Roofline Model
The Roofline Model is a performance analysis framework that visualizes the relationship between arithmetic intensity and achievable hardware performance, providing insights into whether an algorithm is compute-bound or memory-bound.
Core Concepts
Performance Bounds
- Compute Bound: Limited by processor’s computational capacity (FLOPs/s)
- Memory Bound: Limited by memory bandwidth (bytes/s)
- Peak Performance: Maximum attainable performance of the hardware
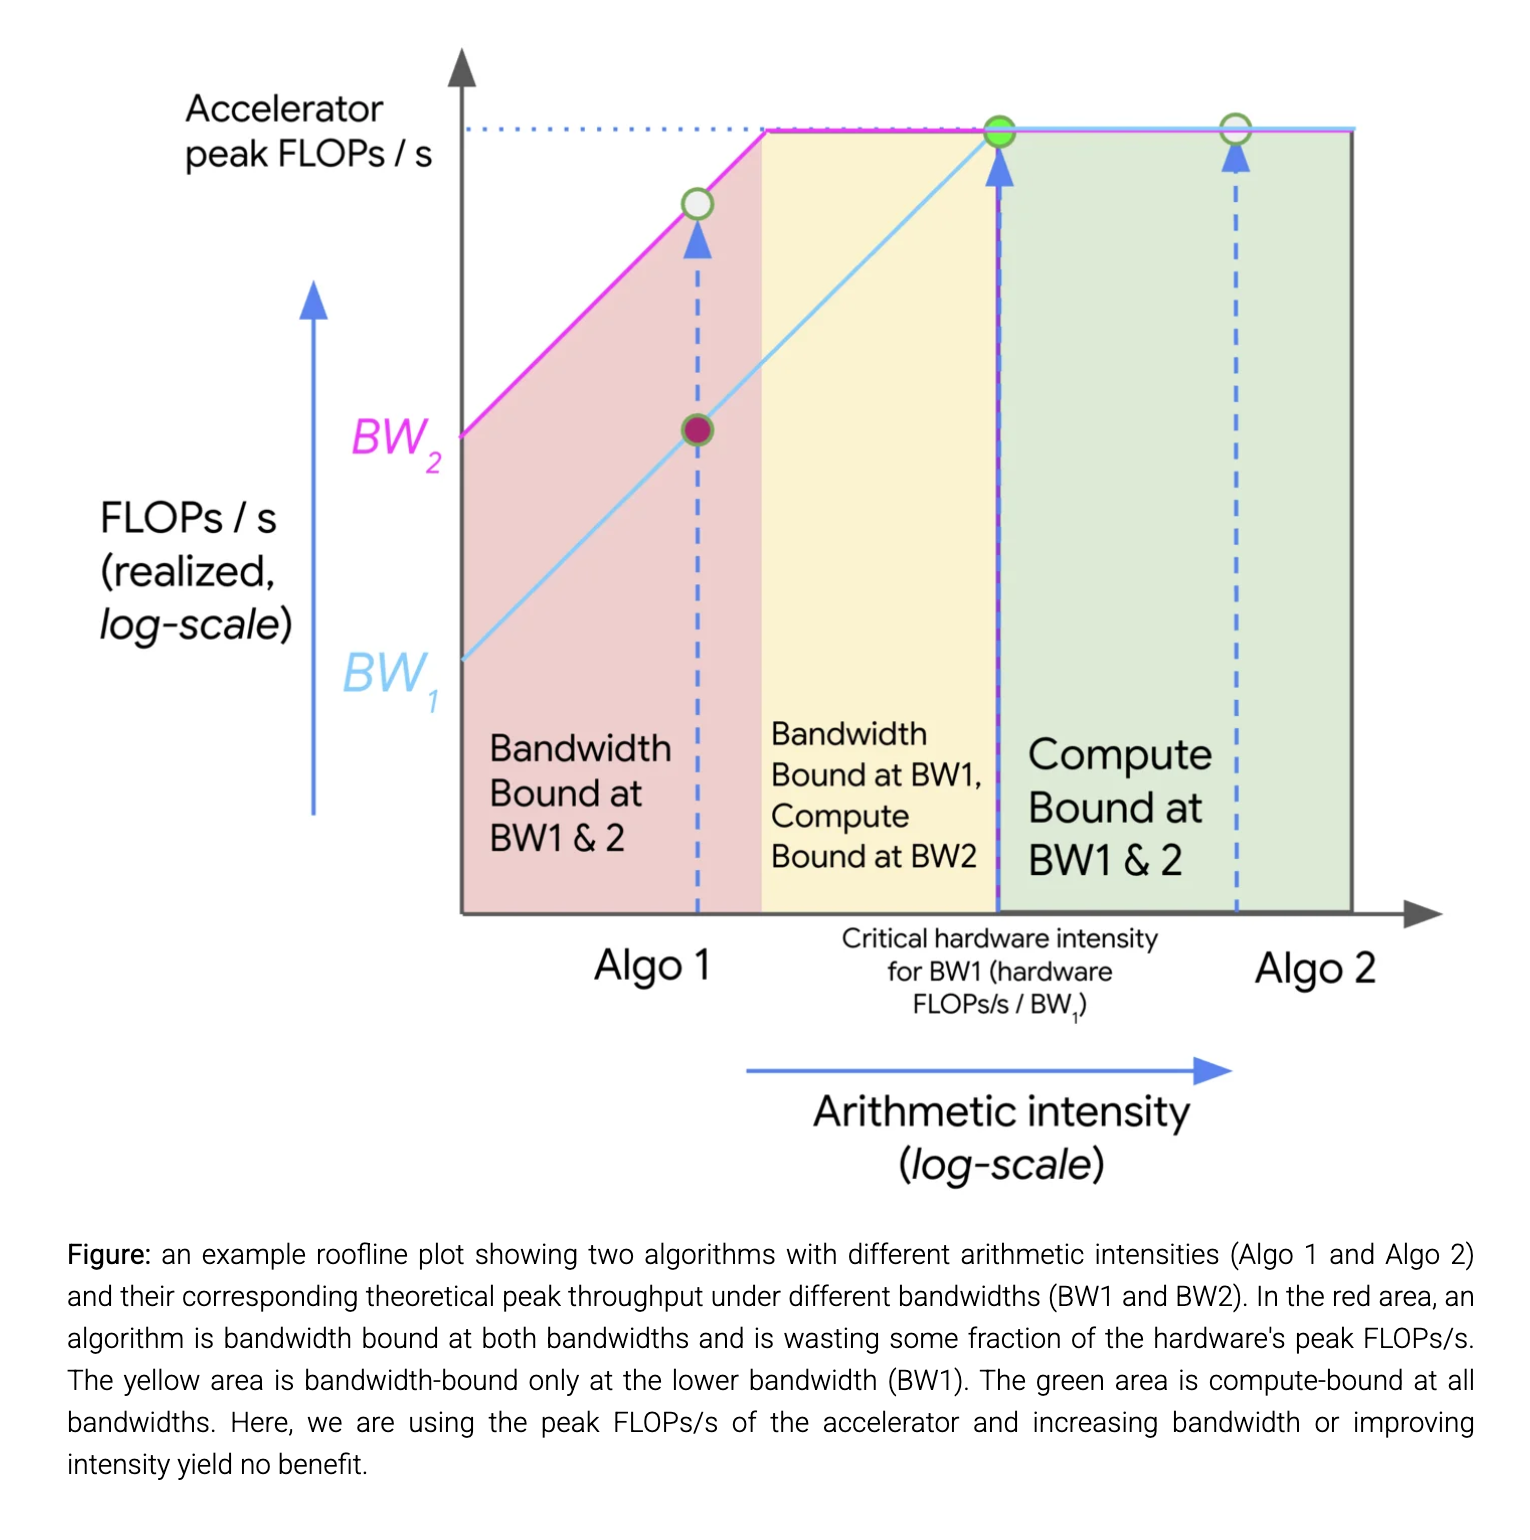
Visualization
A roofline plot shows:
- X-axis: Arithmetic-Intensity (FLOPs/byte)
- Y-axis: Performance (FLOPs/s)
- Sloped region: Memory-bound performance (performance increases linearly with intensity)
- Horizontal region: Compute-bound performance (constant at peak hardware capability)
 Source: How To Scale Your Model - Rooflines
Applications
- Identifying bottlenecks in algorithm implementation
- Guiding optimization strategies (increasing arithmetic intensity vs. bandwidth)
- Comparing algorithm efficiency across different hardware
- Estimating performance improvements from hardware upgrades
Types of Rooflines
- Memory Bandwidth Roofline: Focused on on-chip memory access
- Network Communication Roofline: Focused on inter-chip communication
- Cache Roofline: Analyzes performance with respect to different cache levels
Critical Intensity
The point where an algorithm transitions from memory-bound to compute-bound, calculated as: